Contact us
Download Financial and Performance Data (PDF) [228 KB]
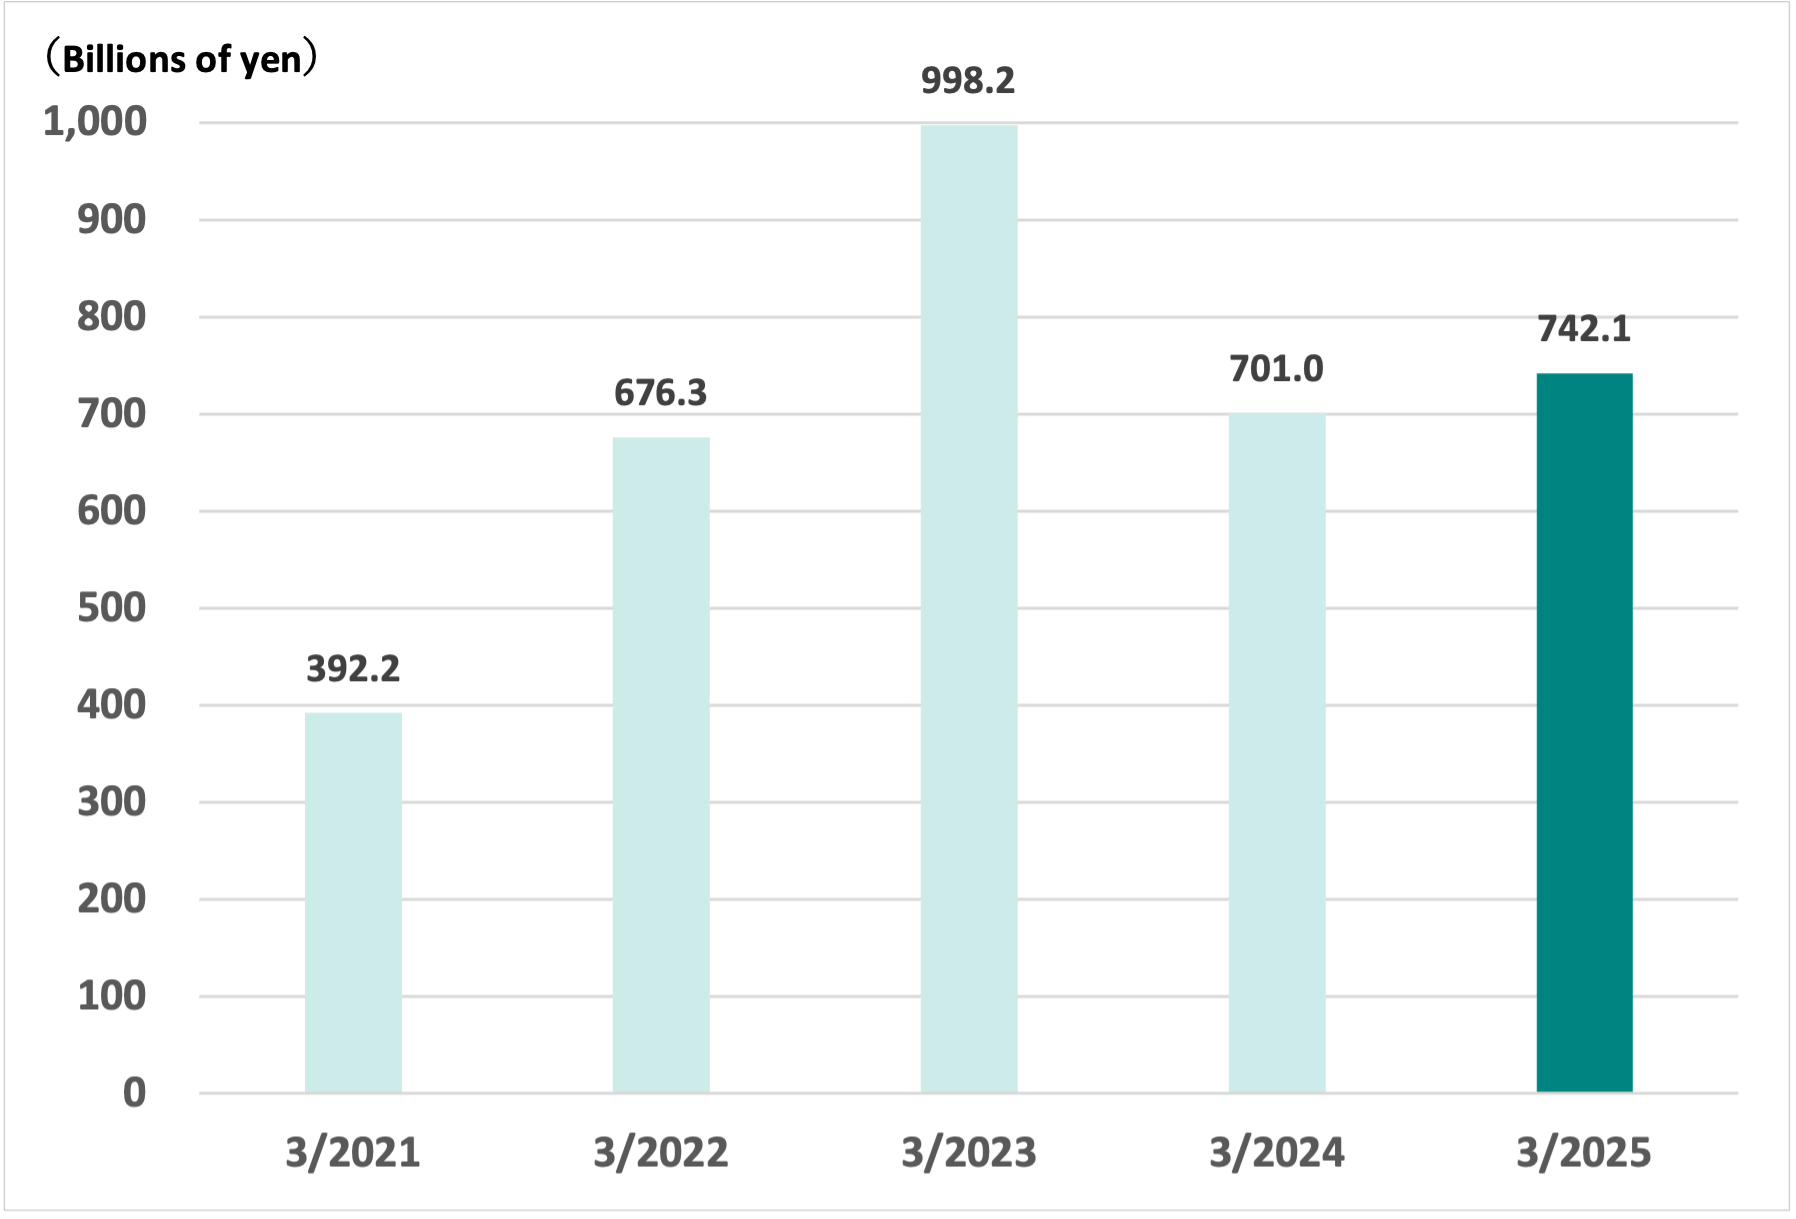
Operating Performance

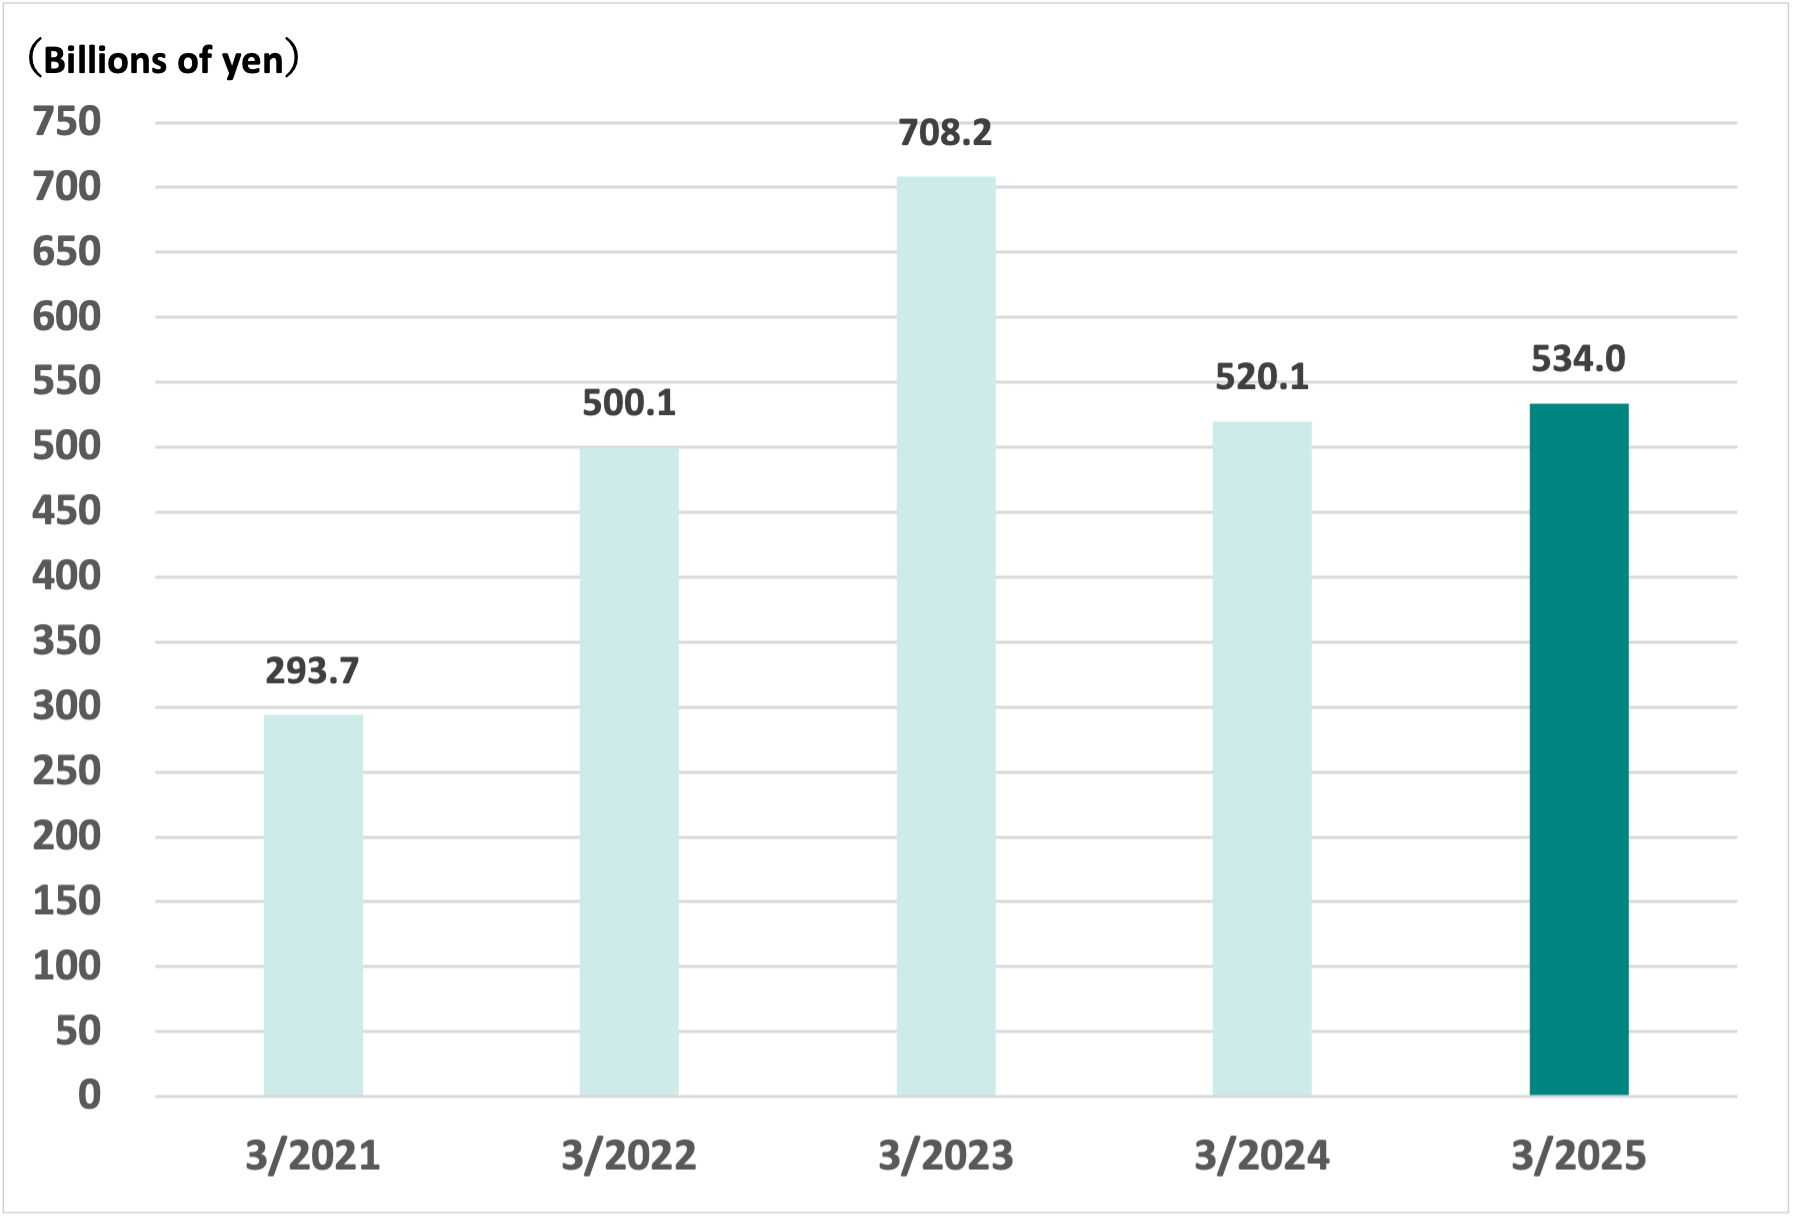
Ordinary income

Net income attributable to owners of parent
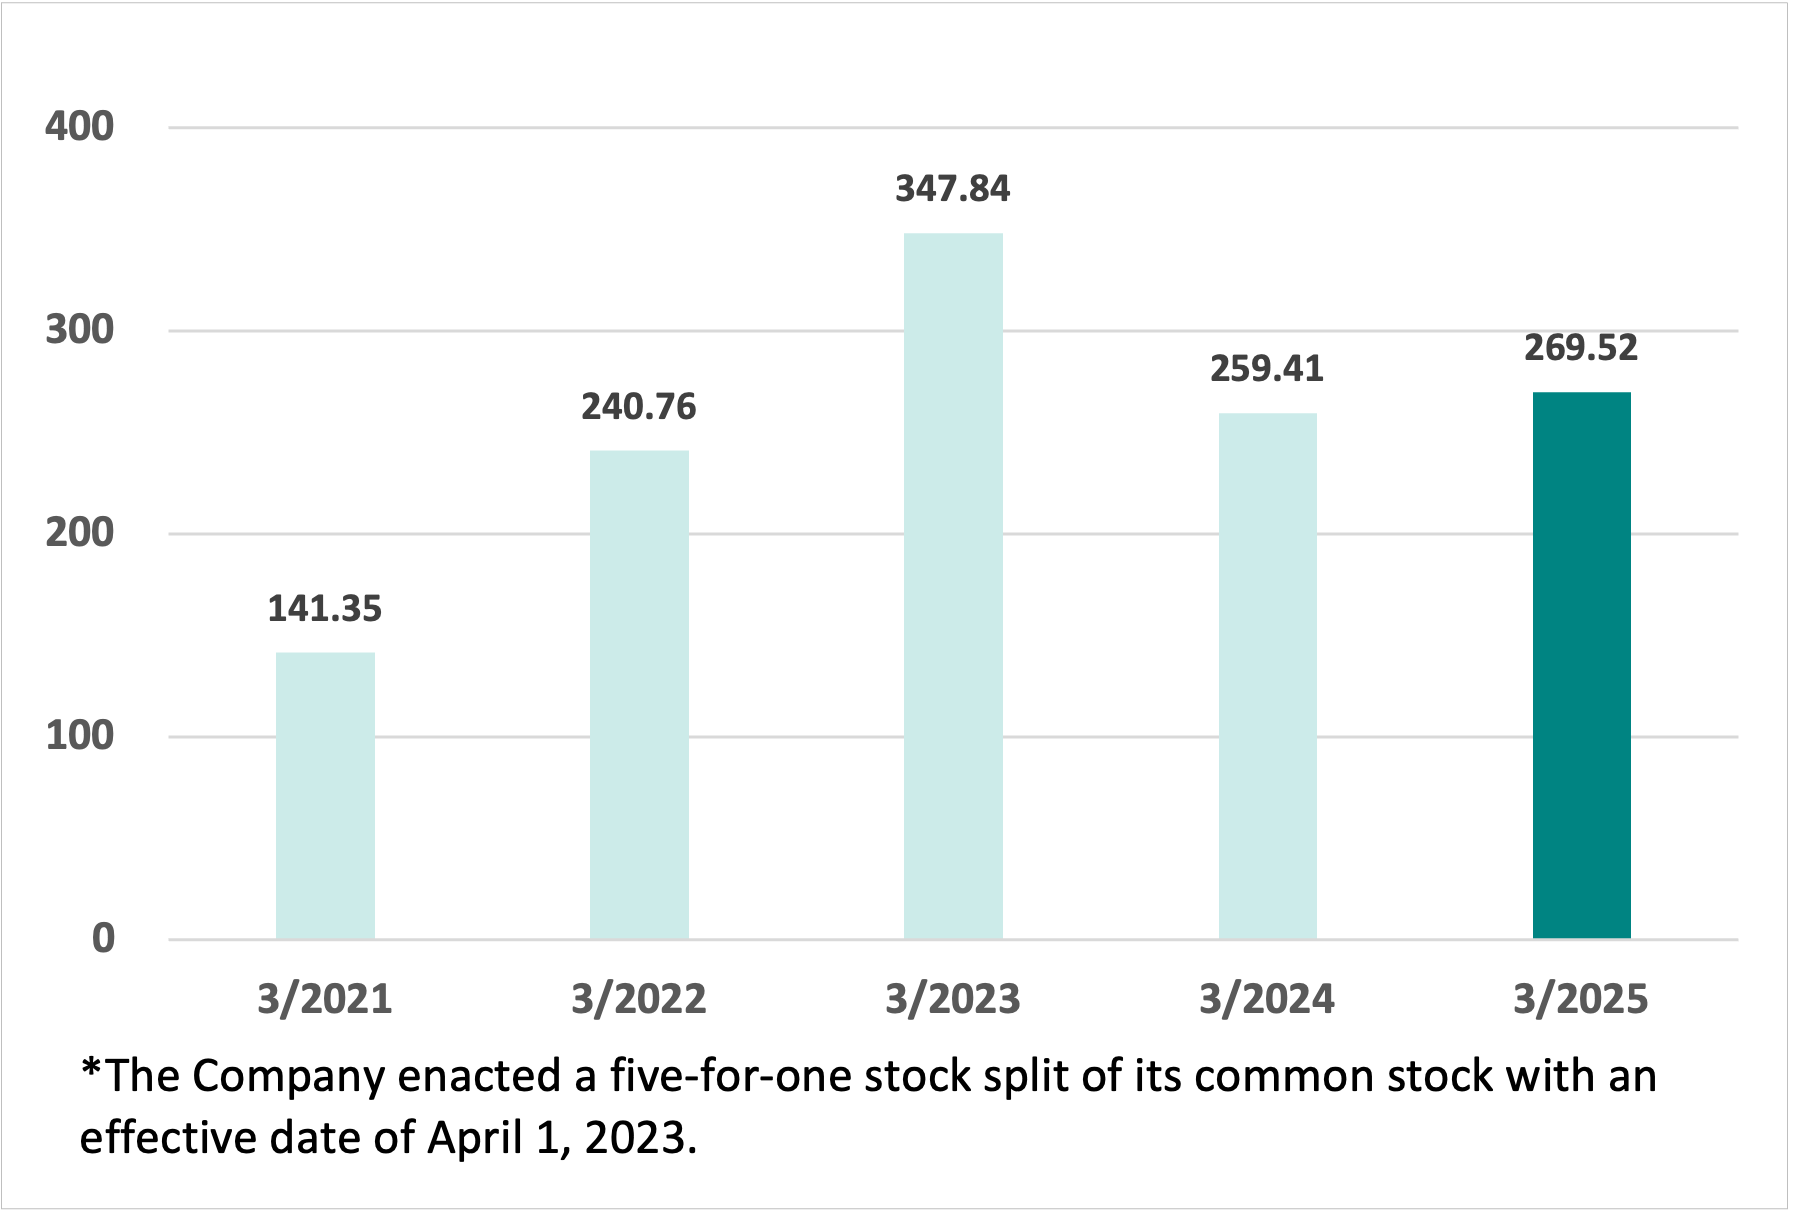
Earnings per share (yen)
Key Indicators
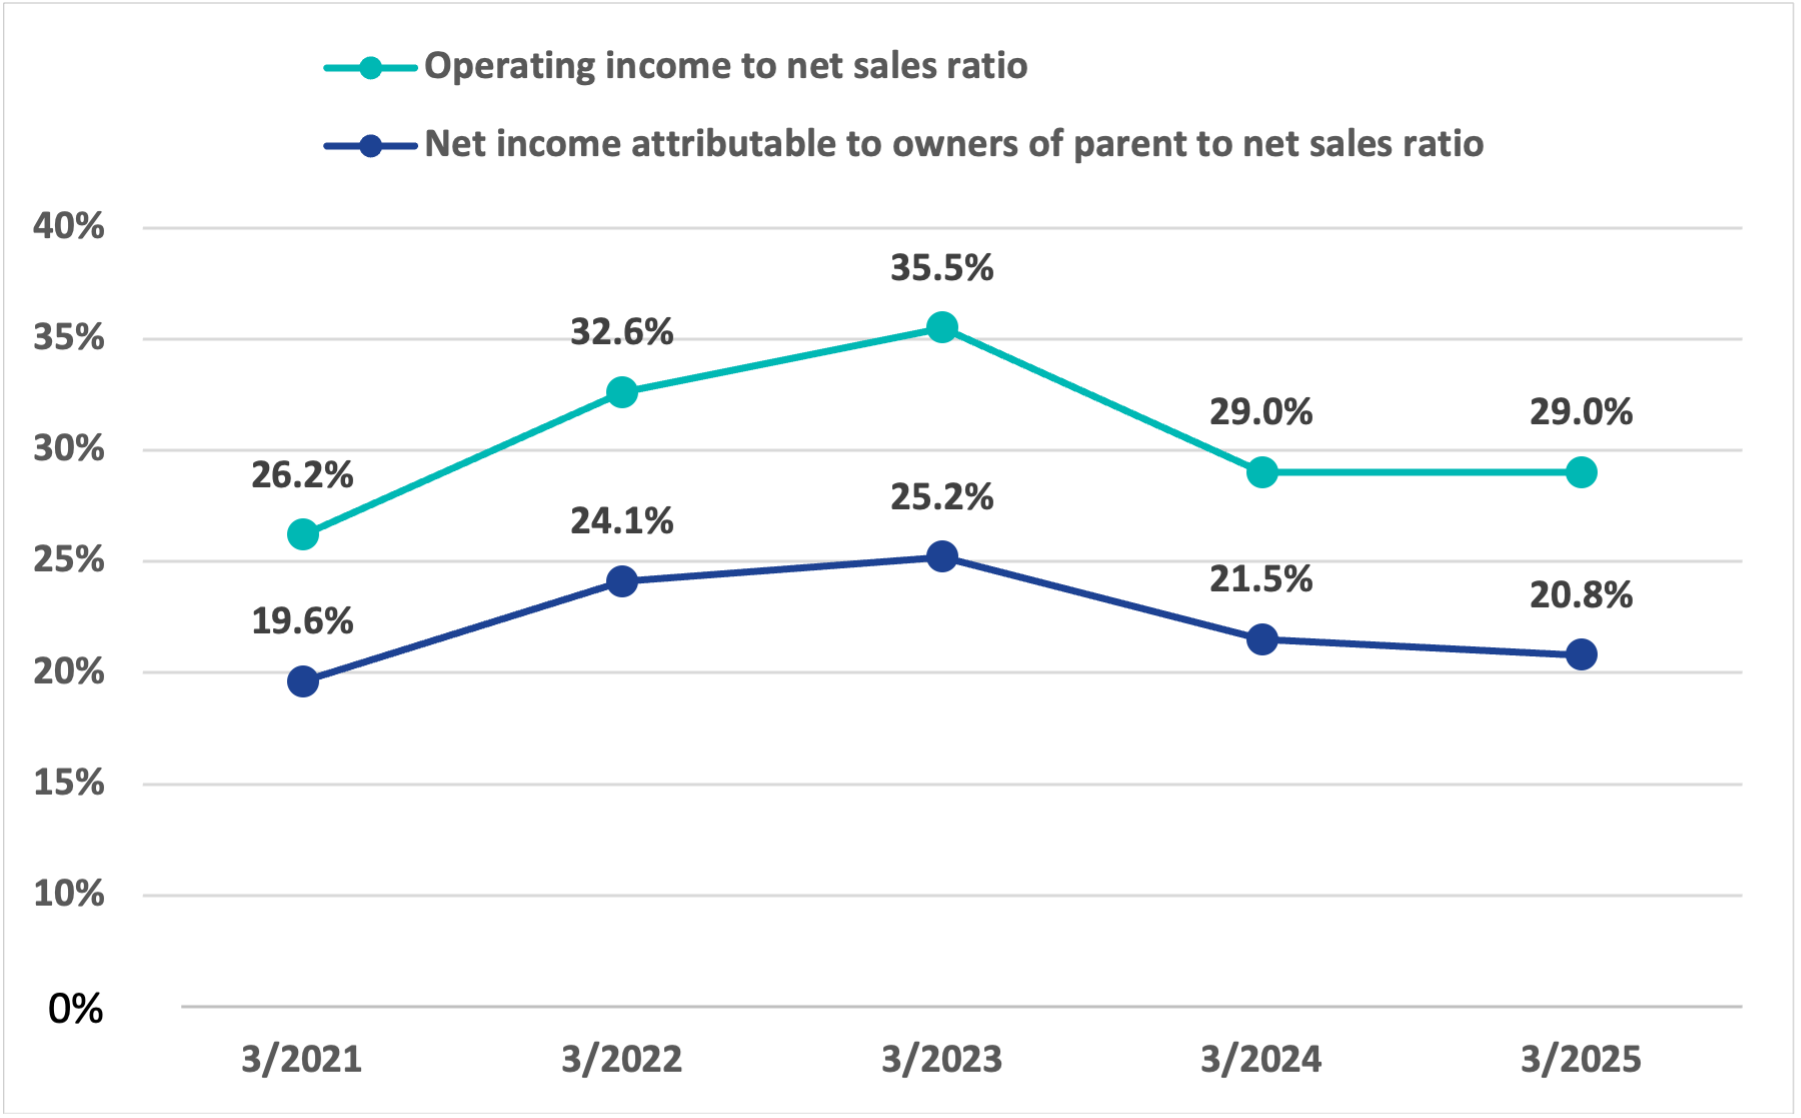
Operating income to net sales ratio/
Net income attributable to owners of parent
to net sales ratio
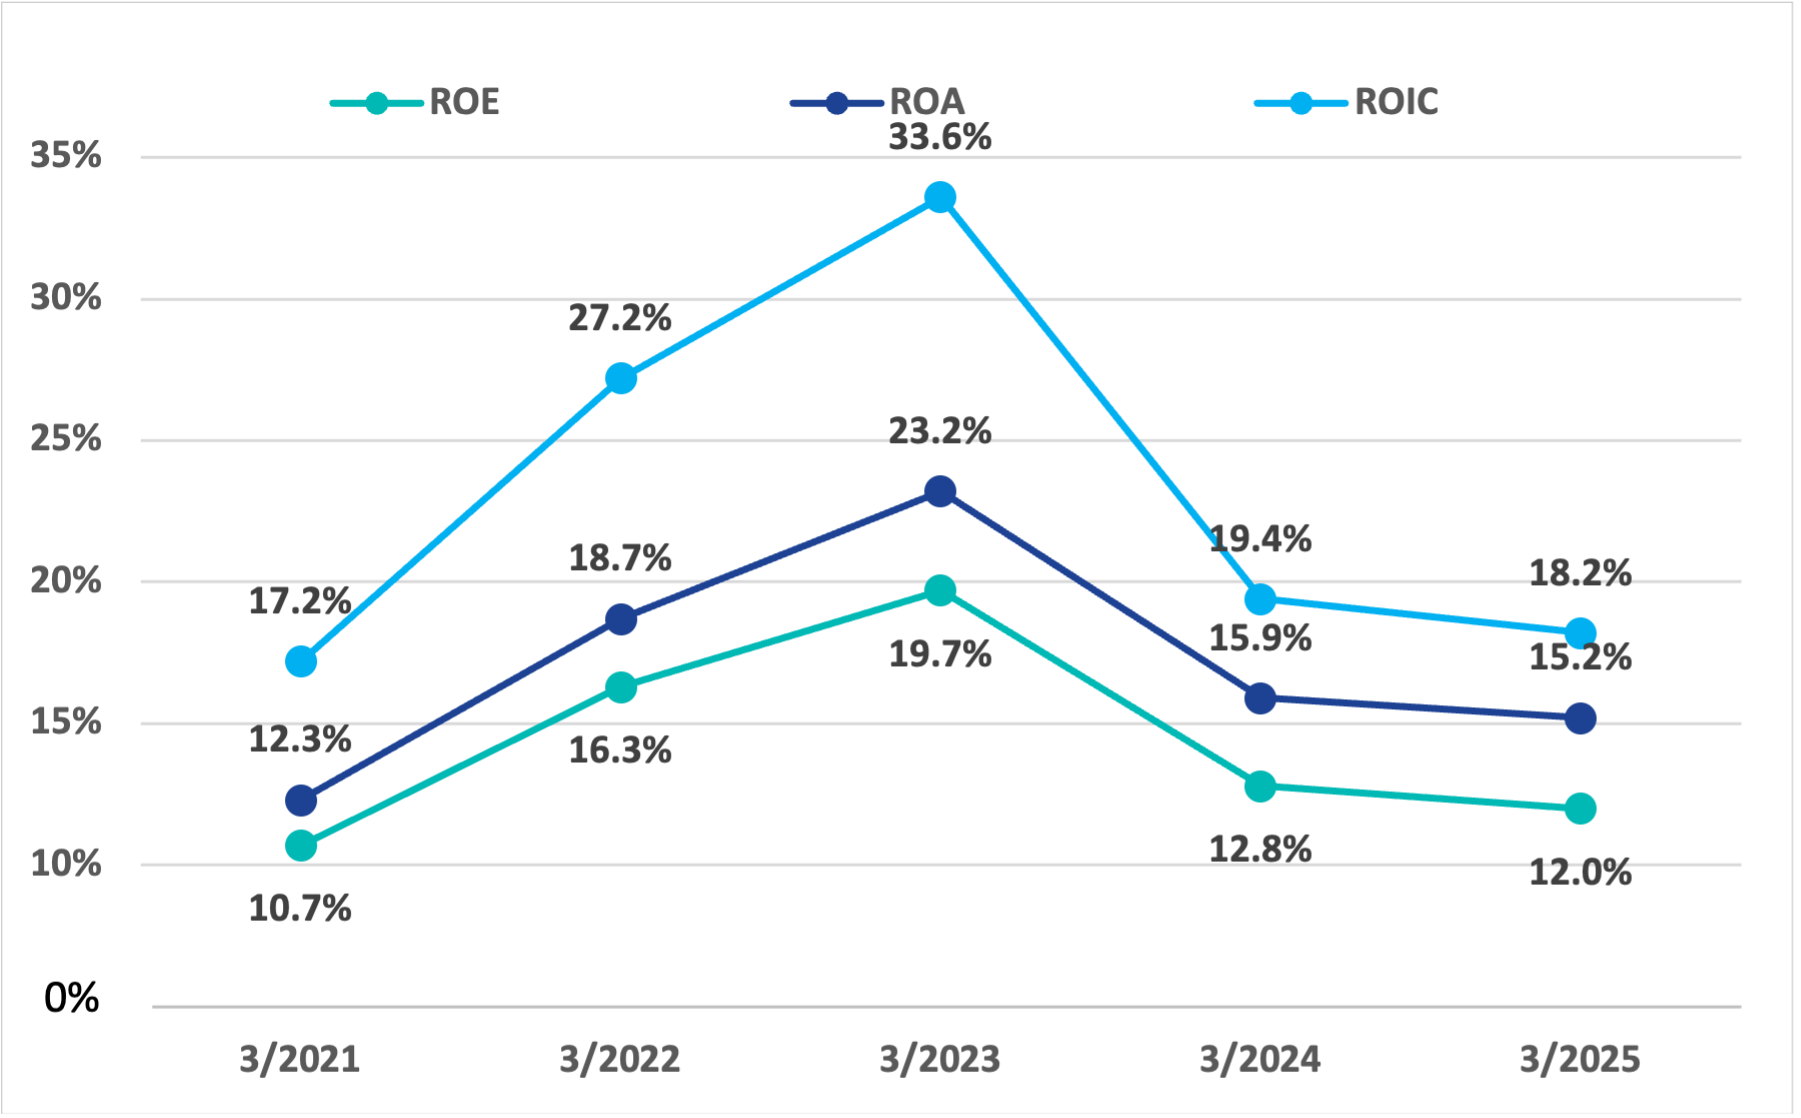
ROE/ROA/ROIC
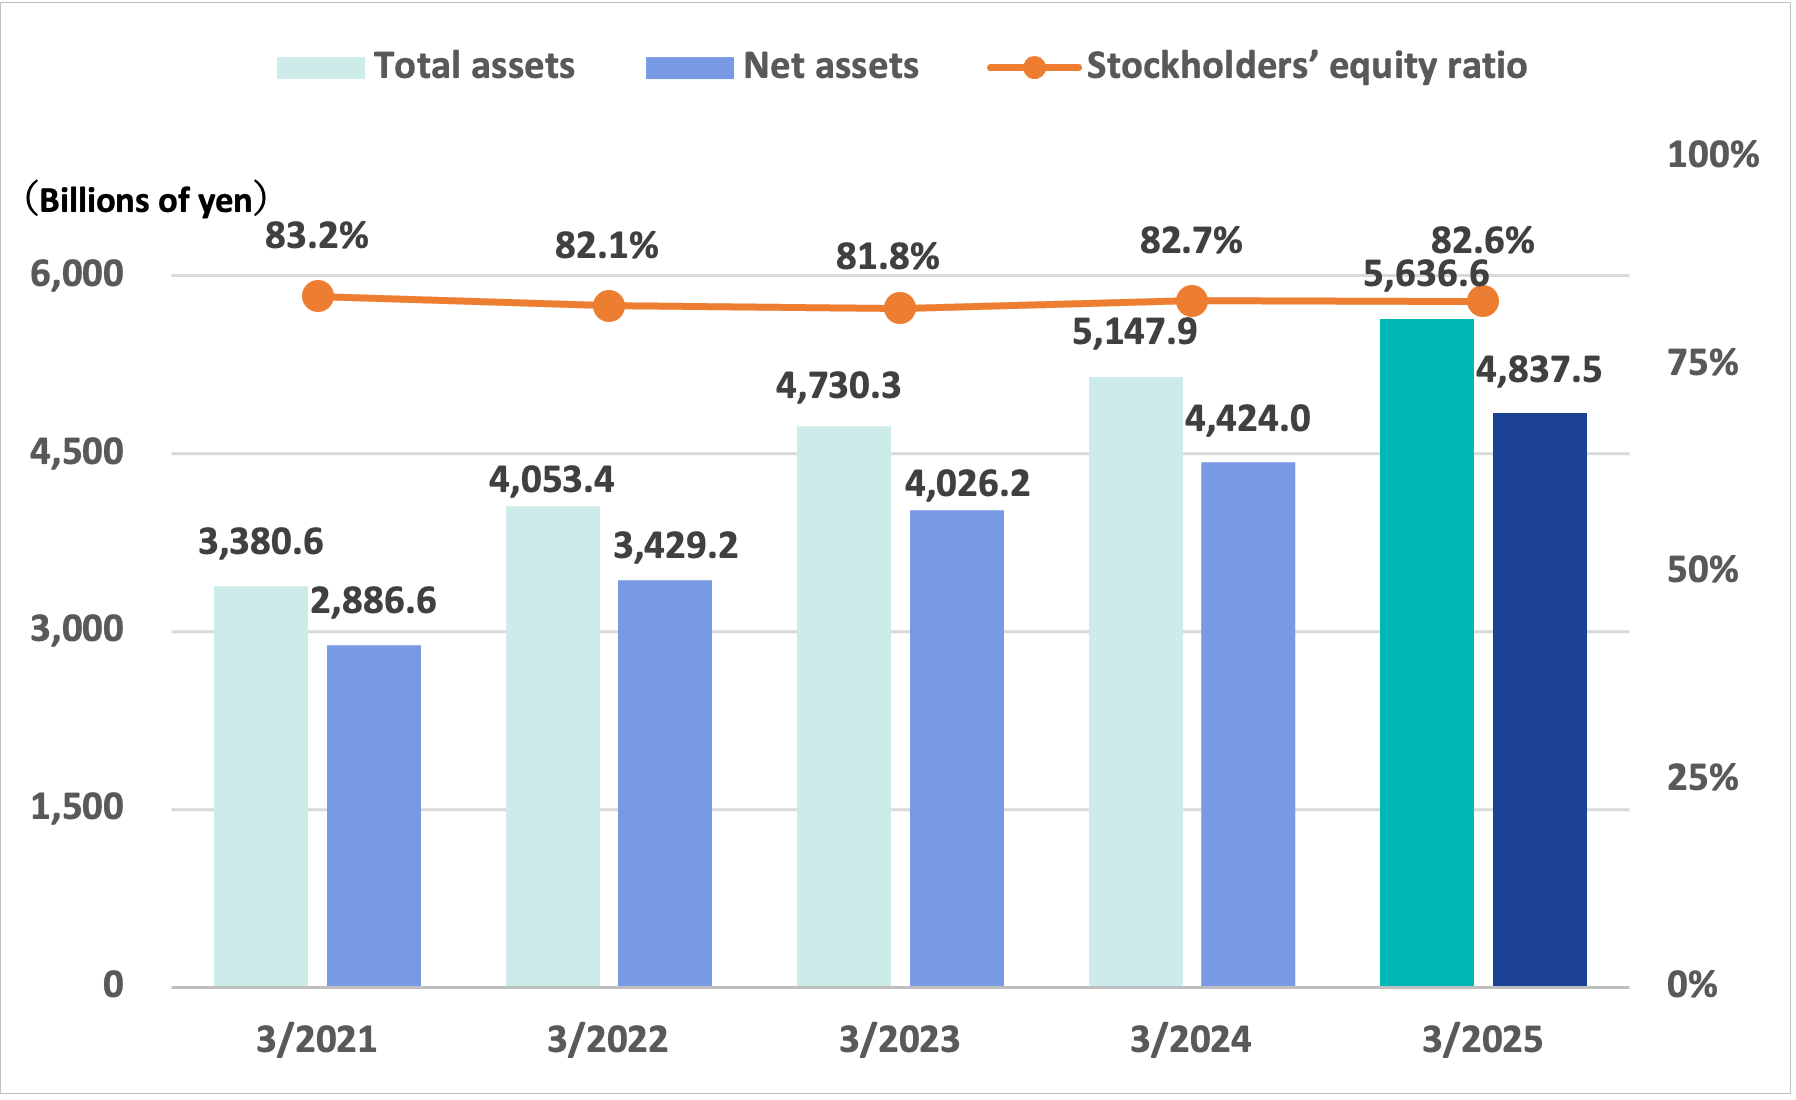
Financial Position
Total assets/Net assets/Stockholders’ equity ratio
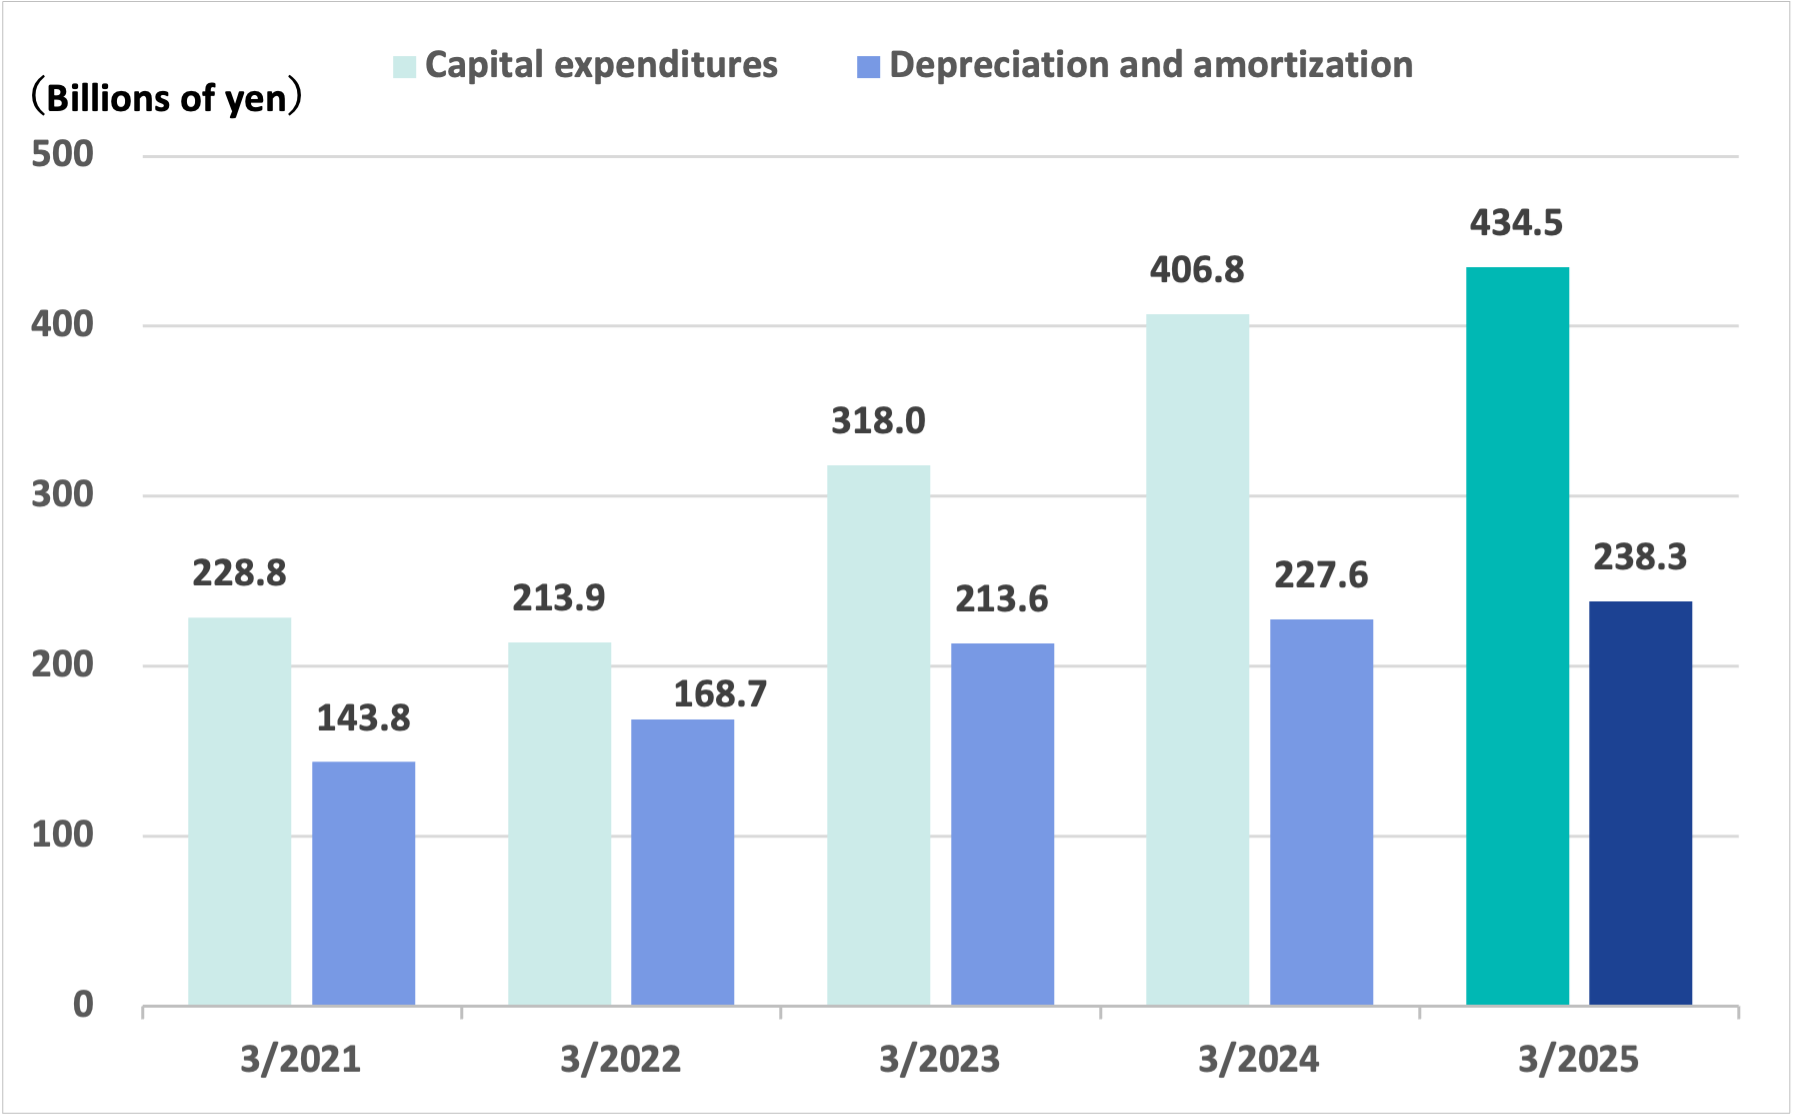
Capital Expenditures and R&D
Capital expenditures/Depreciation and amortization
R&D costs
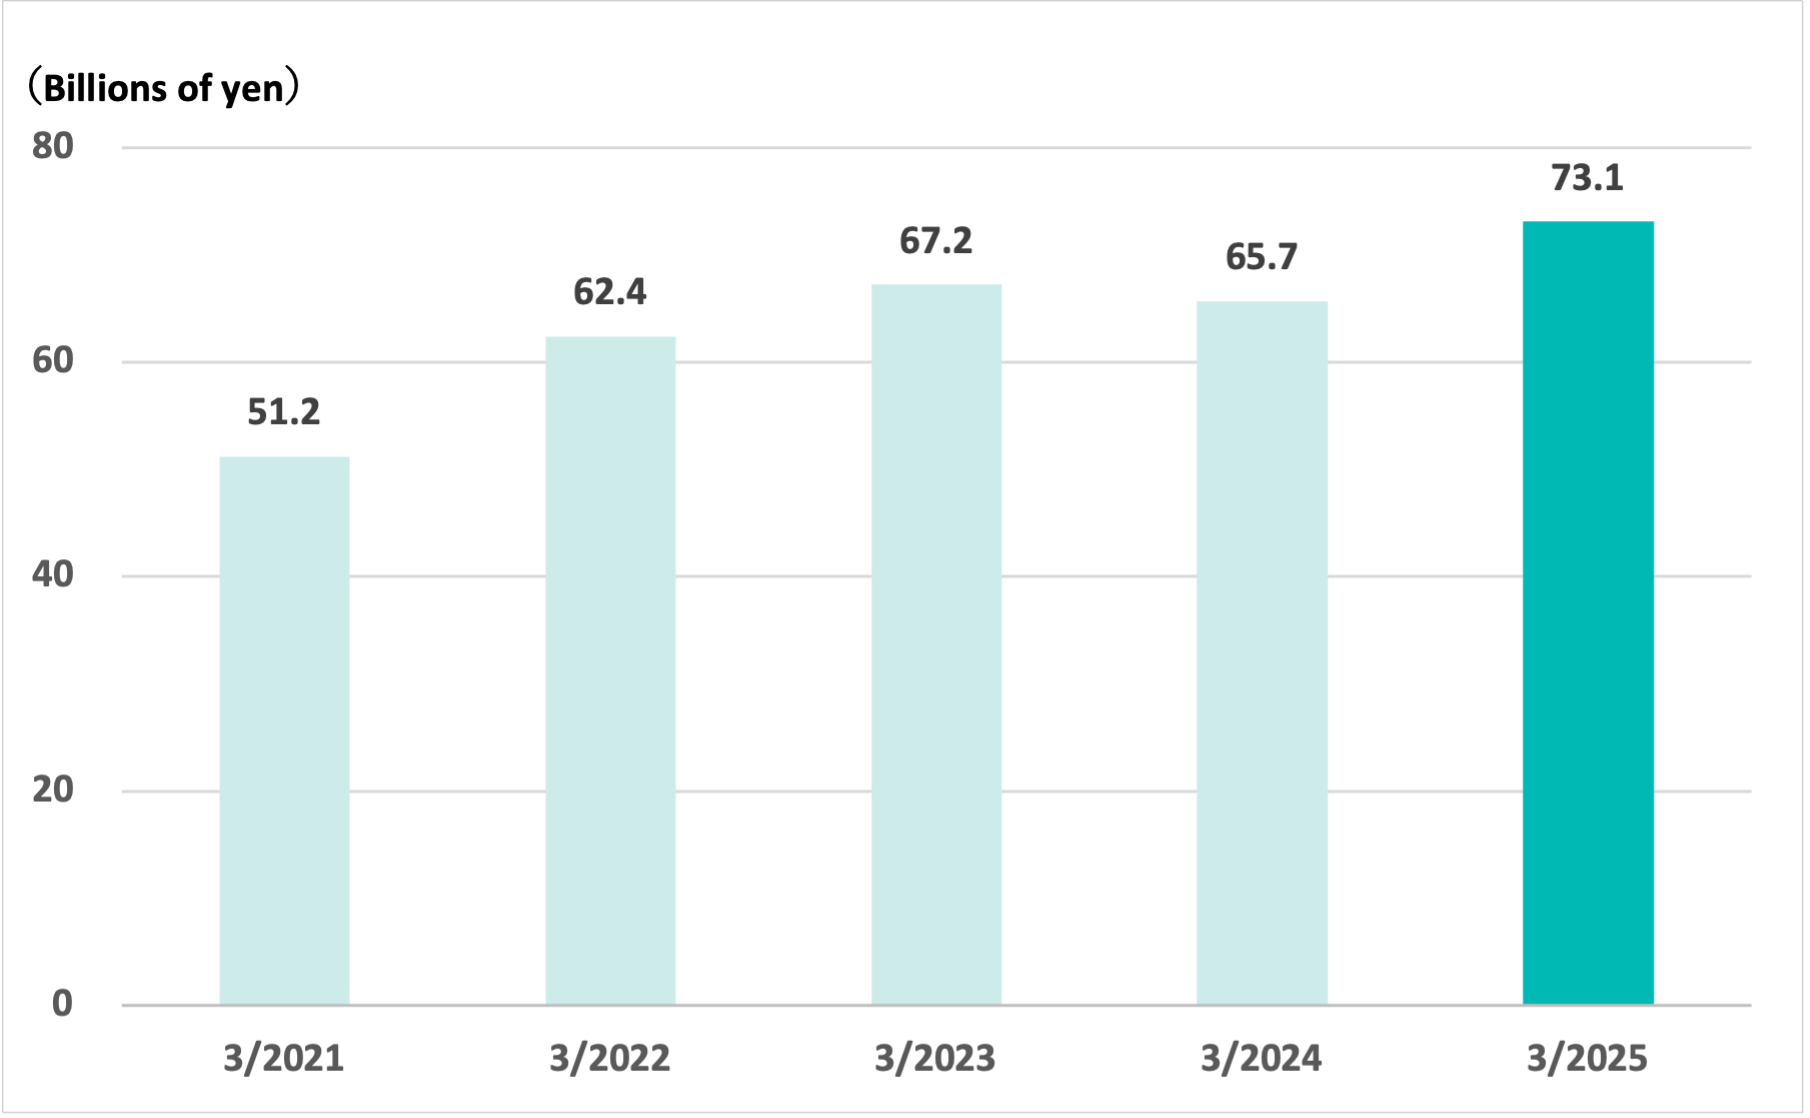
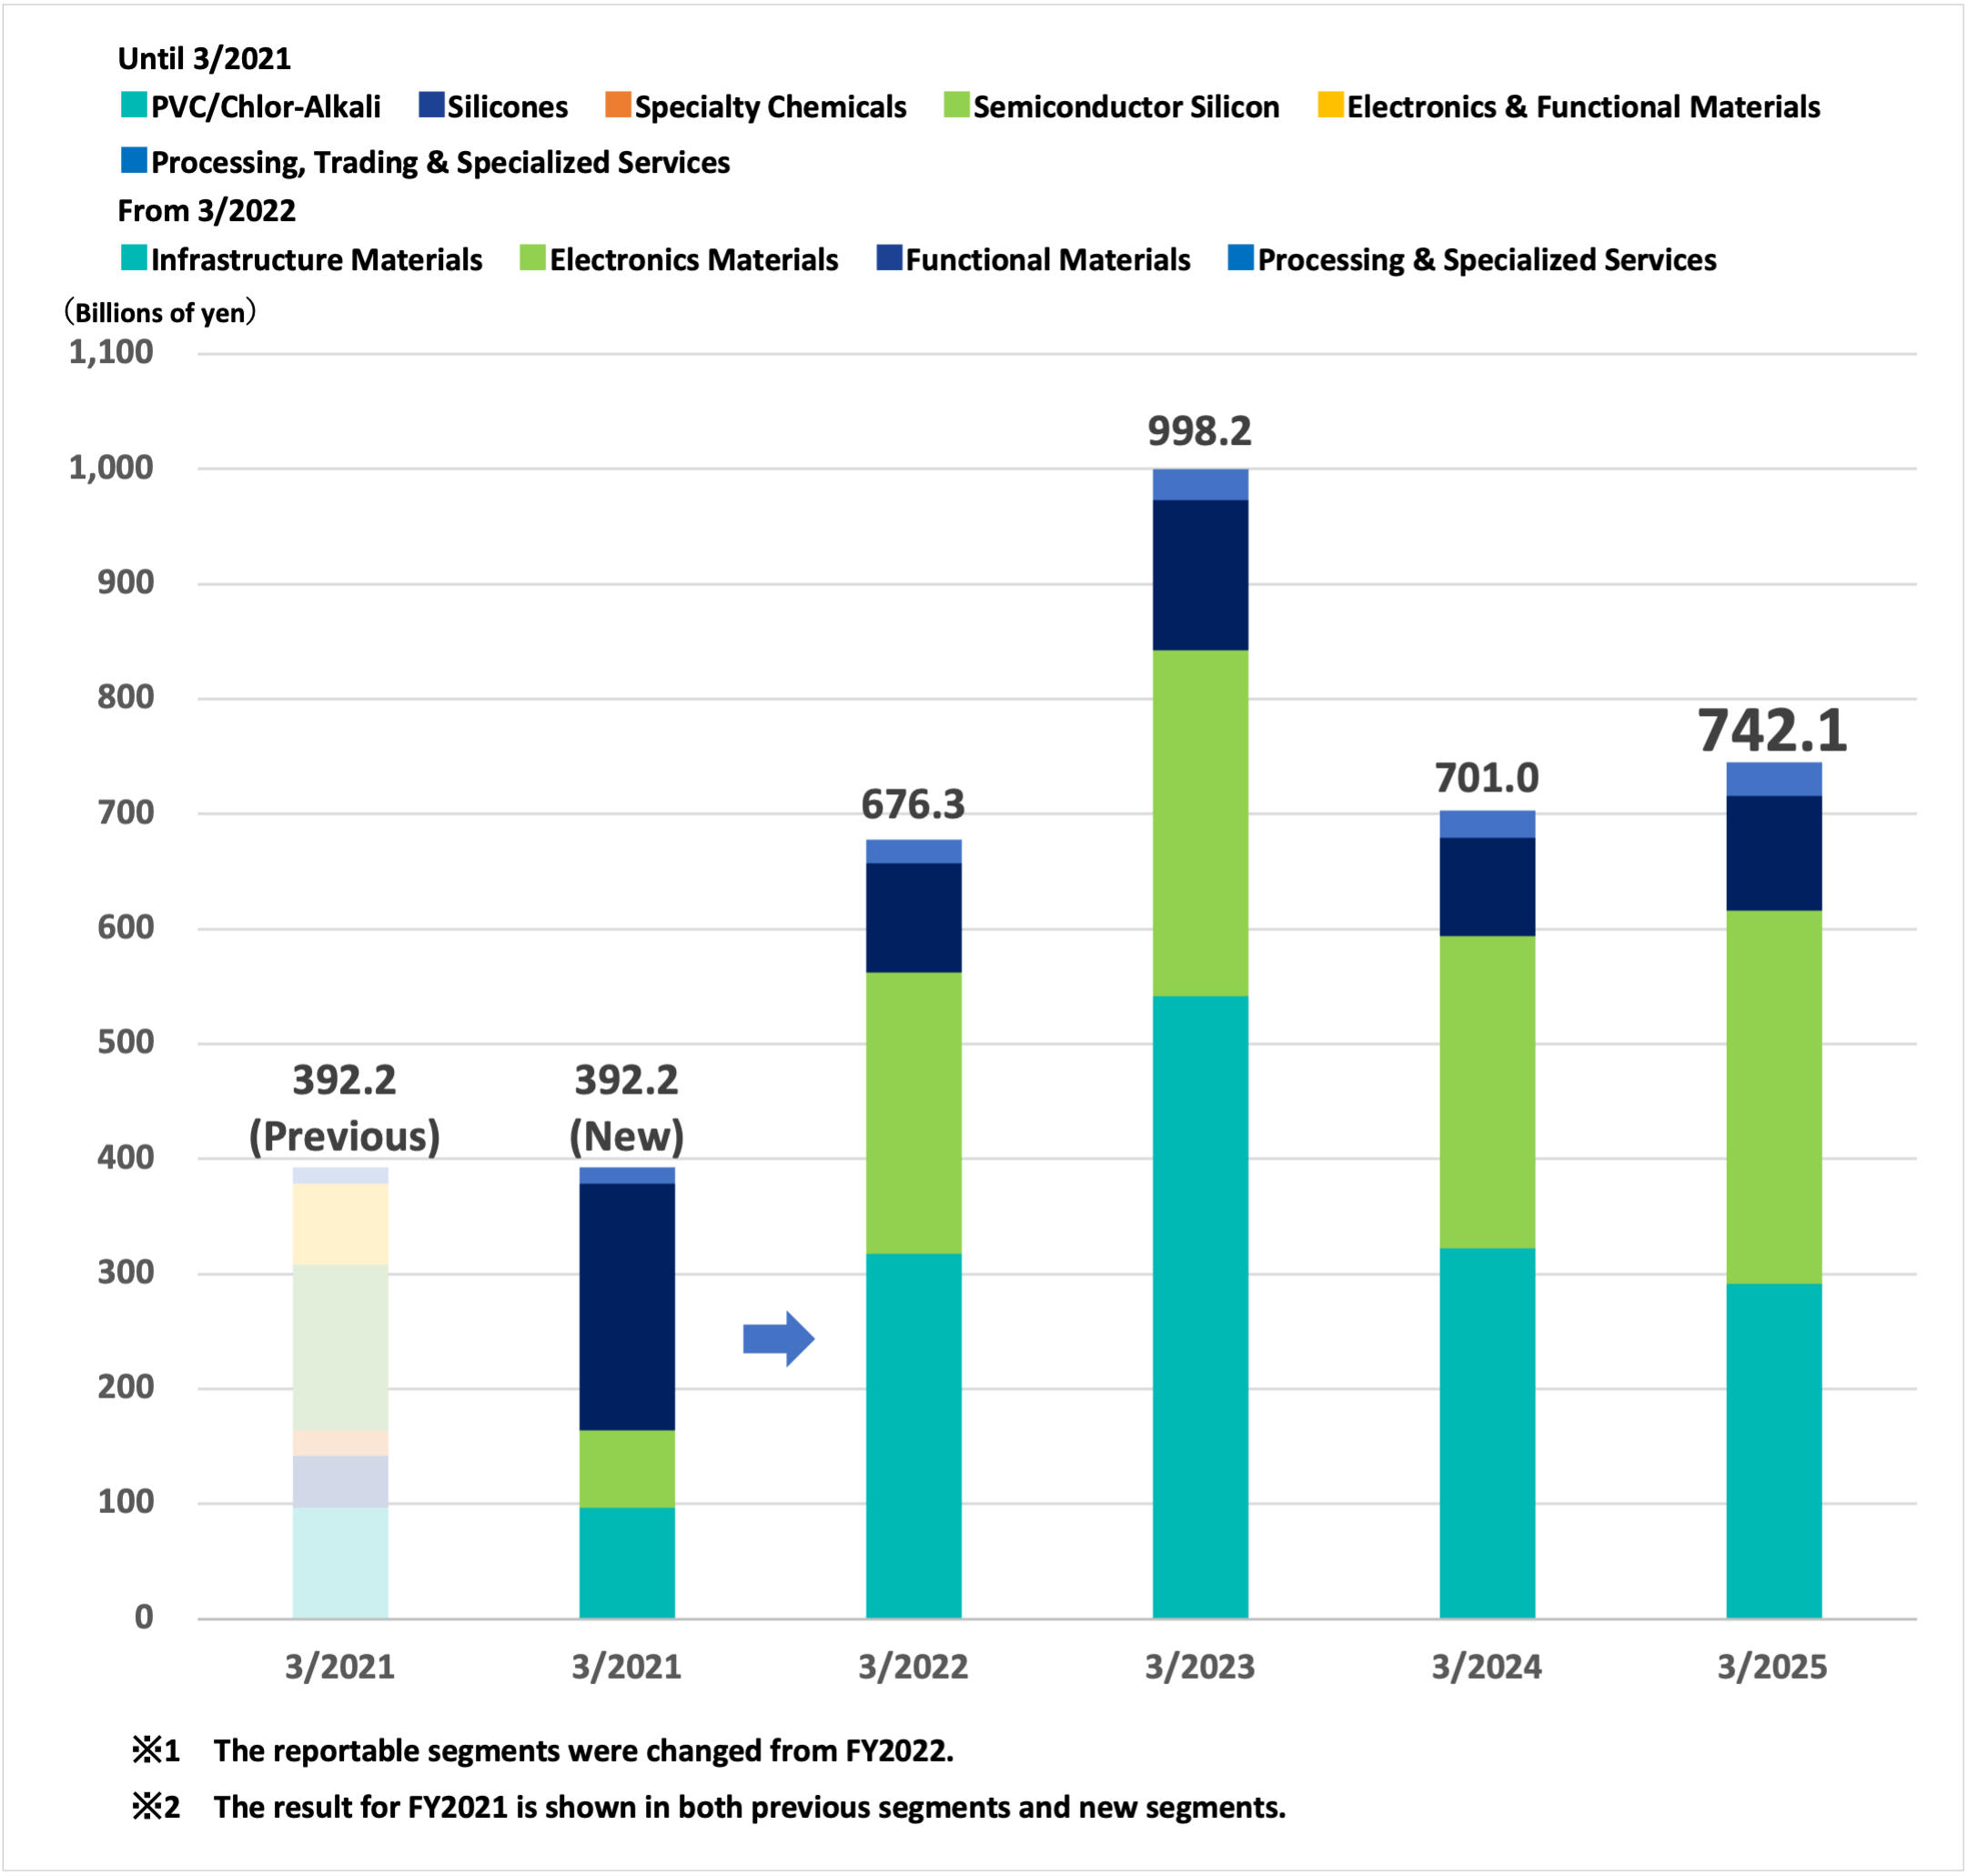
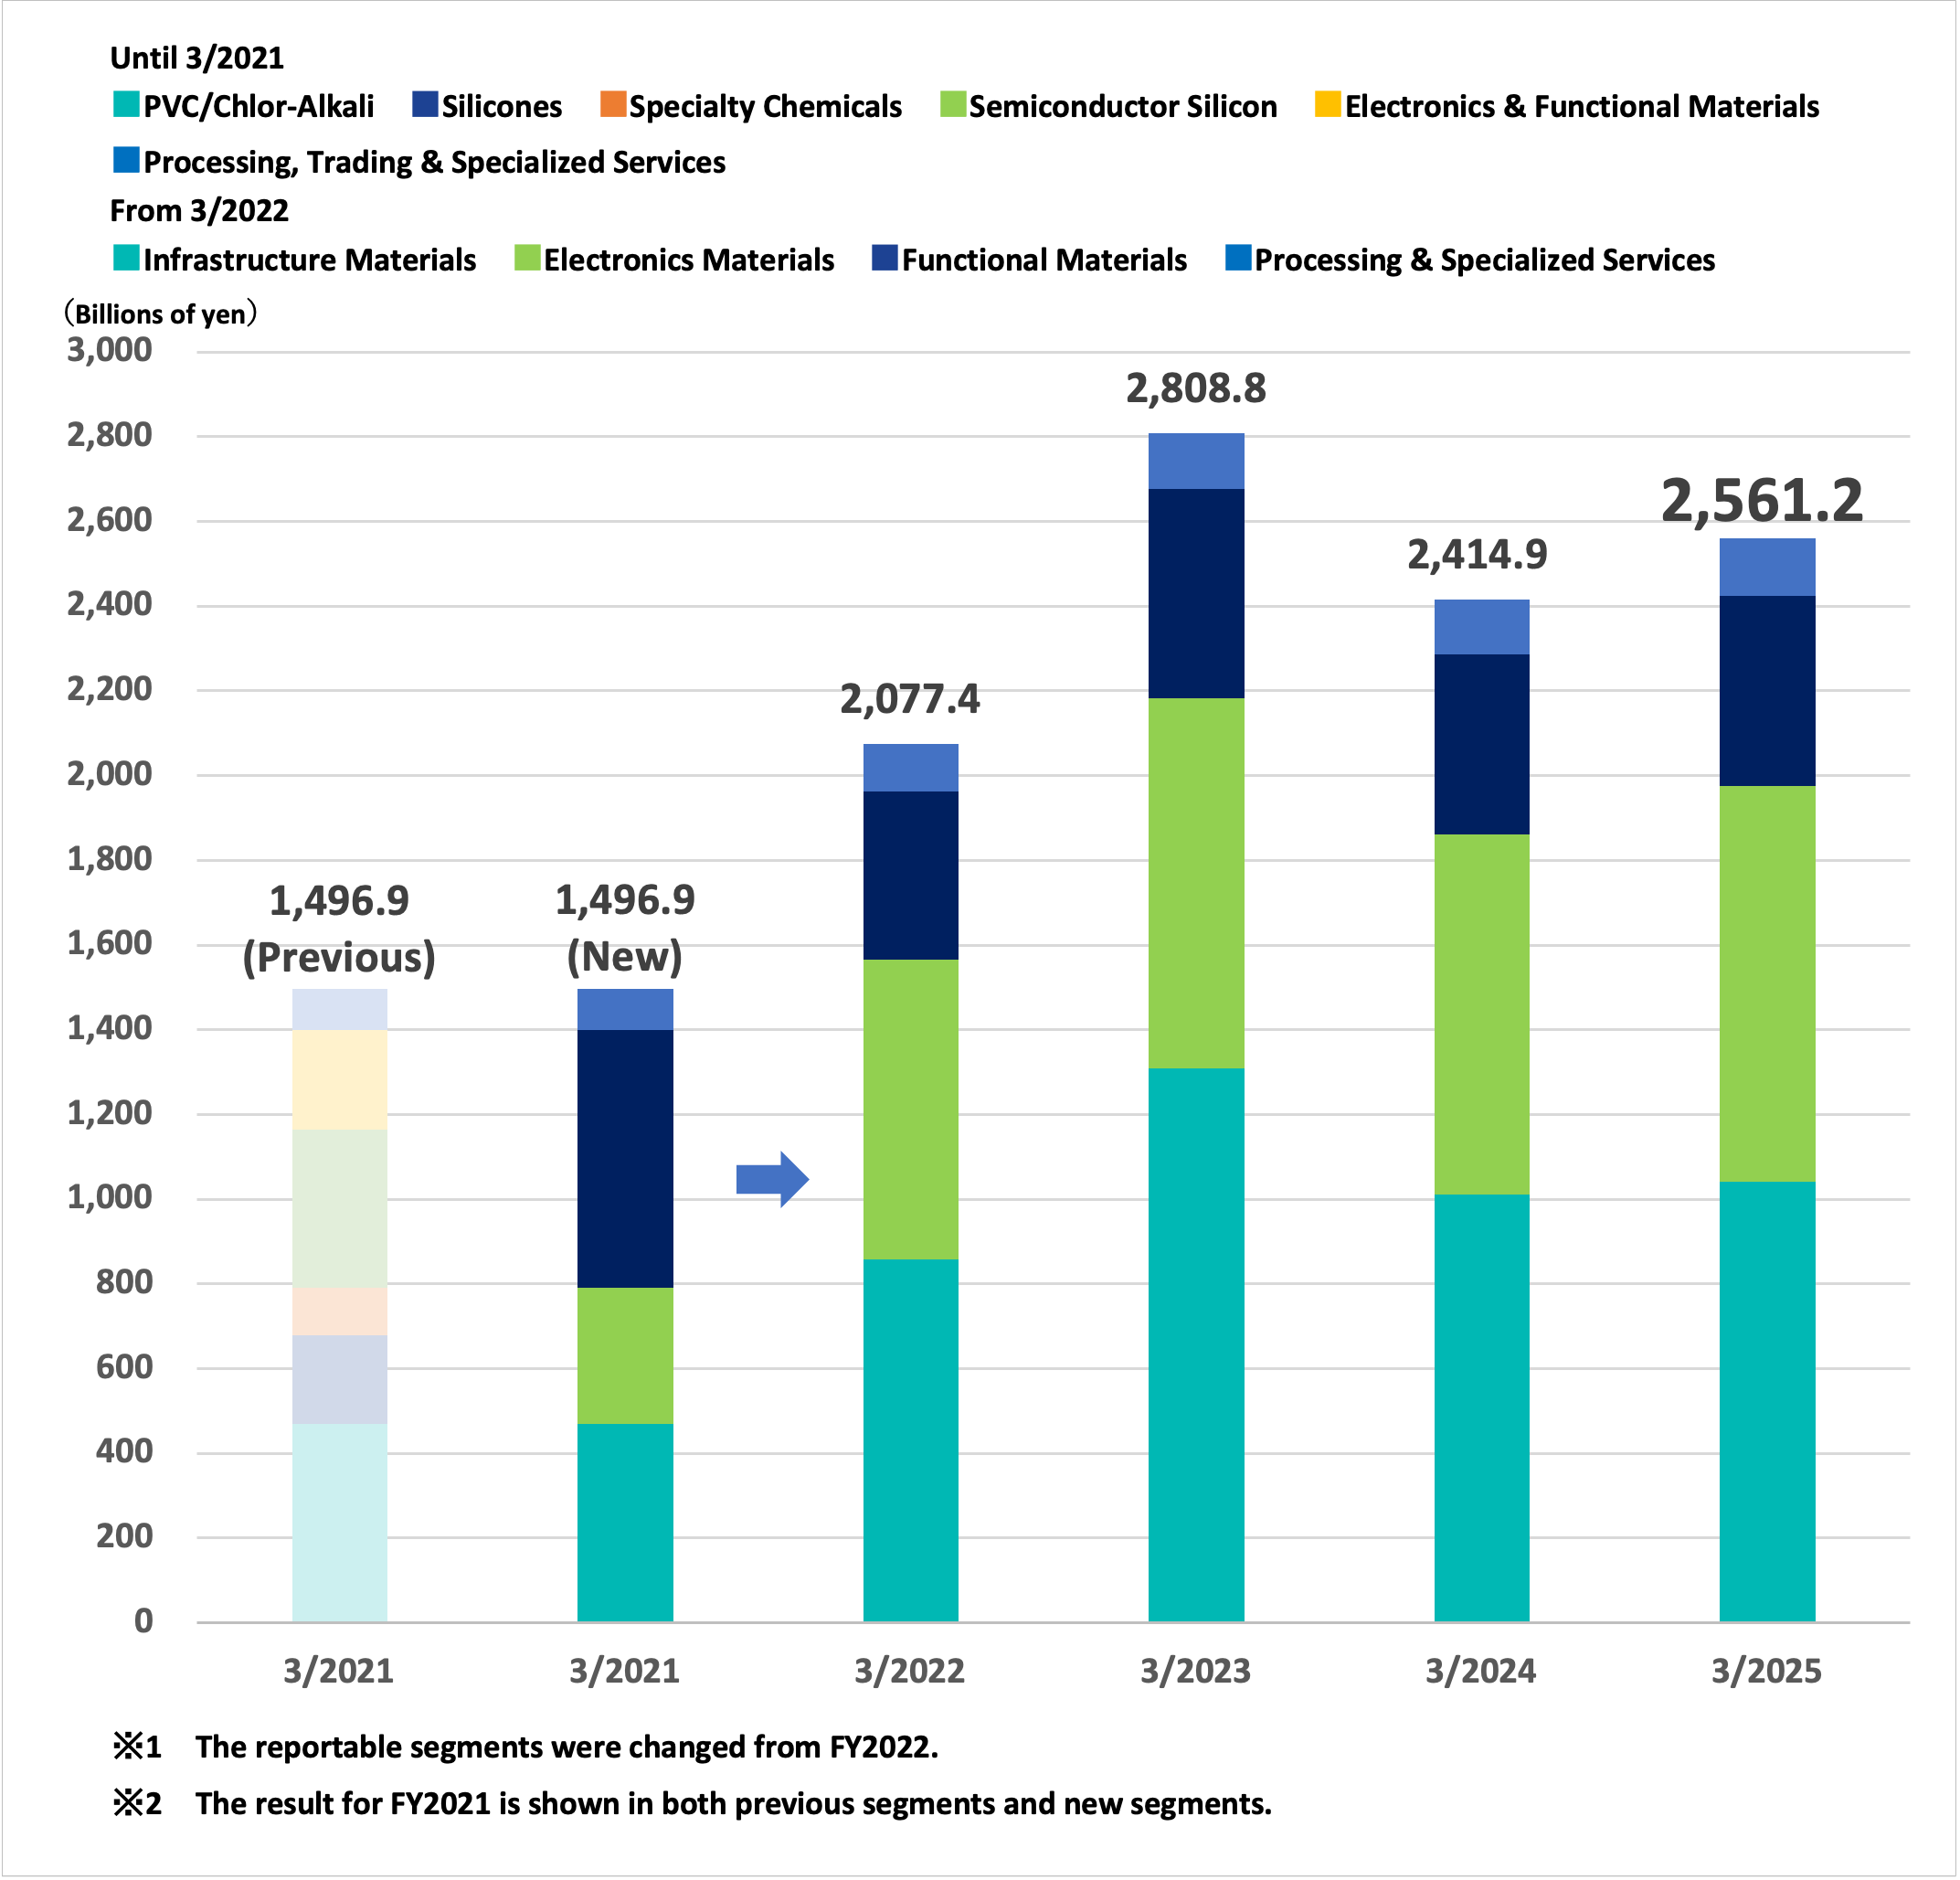
Net Sales and Operating Income by Segment
Net Sales by Segment
Operating Income by Segment